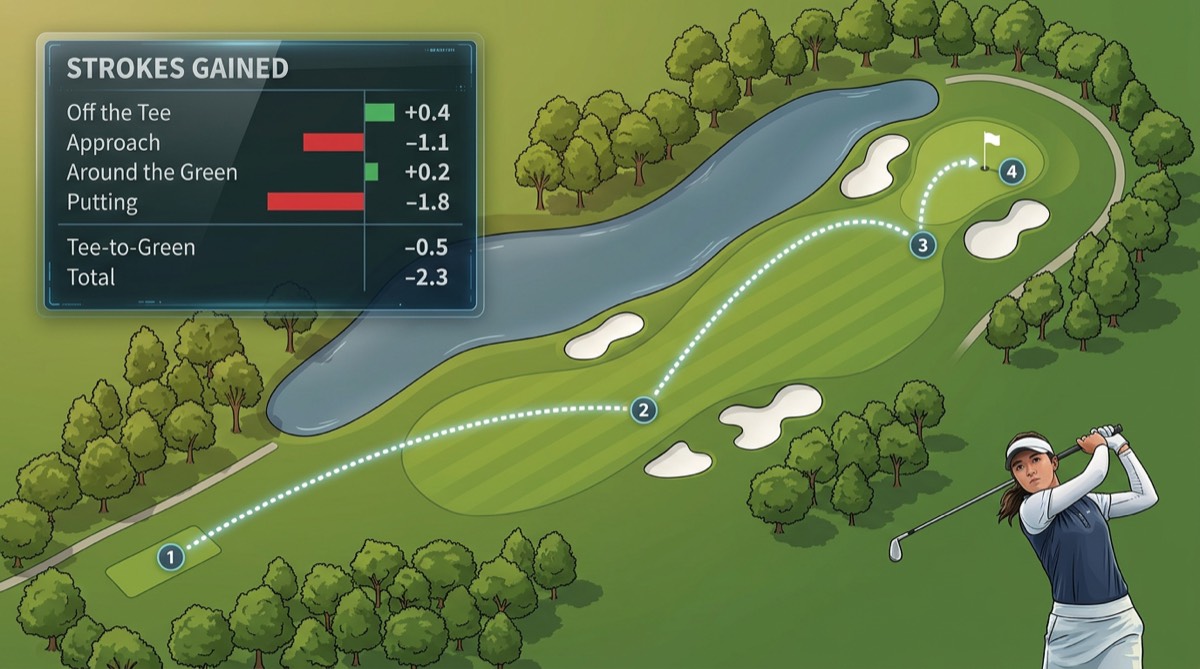
Every golfer has a theory about their own game. Ask what's holding them back and you'll get an instant answer — "my putting," "I can't drive it straight," "my short game's a mess." The confidence is real. The accuracy usually isn't.
Here's the reframe that changes everything: your biggest weakness is your biggest opportunity. It's the one area quietly costing you the most strokes per round — which means it's also where a little focused work returns the most. And it's almost never the shot you remember most vividly. Finding it isn't about hitting more balls or feeling your way to an answer. It's about measurement. This guide walks through exactly how to find your highest-upside area, category by category, and turn it into a plan.
Why you can't trust your gut
Memory is a terrible strokes-gained analyst. We remember the dramatic misses — the shanked wedge, the three-putt on 18 — and quietly forget the ordinary ones, like the drive that left an awkward layup or the approach that never gave you a look. So the shot you feel worst about is rarely the one costing you the most.
There's an emotional weighting problem too. A missed short putt stings more than a so-so approach, so it looms larger in your self-assessment. The result is a systematic bias: golfers over-blame putting and the short game, and under-account for the approach shots that put them in trouble in the first place. To find your real weakness, you need a record that doesn't forget and doesn't get emotional.
The fastest strokes to gain are hiding in the one part of your game you're not measuring.
Break your game into the four scoring categories
Every stroke you take falls into one of four buckets. Diagnosing a weakness means measuring each one separately, because "I played badly" isn't actionable — "I'm losing two strokes a round on approach" is. Here's what each category is really telling you, and the one stat in each that most golfers get wrong.
1. Off the tee
Track: fairways hit, penalty/recovery rate, and average drive distance. The question isn't just "straight or not" — it's whether your tee shots leave you in position to score. A short drive in the fairway can cost more than a long one in the light rough. Watch for penalty shots especially; one lost ball per round is a stroke you'll never out-putt.
2. Approach play
Track: greens in regulation broken out by distance band (under 100, 100–150, 150+ yards), and proximity to the hole. This is the most under-measured and, for most amateurs, the most important category. It's also invisible on a normal scorecard — which is exactly why it hides so many lost strokes.
3. Short game
Track: up-and-down (scrambling) percentage, and which lies and distances you miss from — chips, pitches, bunkers, anything inside roughly 50 yards. "My short game is bad" is too broad to fix. "I don't get up and down from greenside bunkers" is a practice session.
4. Putting
Track: putts per green in regulation and make-percentage by distance (short, mid, long) — not total putts per round. Total putts is the single most misleading stat in golf: a low number often just means you missed greens and chipped close, while a high number can mean your approach play is leaving you 40 feet away, not that your stroke is broken.
How to collect the data
You don't need a launch monitor to do this. You need consistency. There are three realistic ways to capture the numbers:
- Pencil and scorecard. Mark fairway, GIR (with rough distance), putts, and up-and-down on every hole. Free, but tedious — and the easiest method to abandon after three holes.
- A stats app. Enter your shots after the round. Faster, and it computes some of the metrics for you, but most apps stop at raw counts.
- A platform that does strokes gained automatically. The only approach that compares each shot to a baseline and ranks your categories by strokes lost — which is what actually points to your weakness.
Whichever you choose, the non-negotiable is volume: aim for 8–10 rounds before you draw conclusions. One round is a mood, not a pattern.
Read the results: find where the strokes are waiting
This is where it comes together. Don't look at each stat in isolation — compare every category against a target (a scratch baseline, or the handicap you're chasing) to see where you lose the most strokes relative to where you want to be. That comparison is Strokes Gained, developed by Columbia Business School professor Mark Broadie. The category with the biggest negative number is your biggest opportunity — the place with the most strokes to gain back. Full stop.
Here's what that looks like for a typical mid-handicapper who was dead certain their short game was the problem:
The putting this golfer obsessed over was actually a slight strength. The real opportunity — long approach shots — never showed up on a scorecard, because "green missed from 165 yards" just looks like a bogey, not a diagnosis. That's the entire point of measuring: it moves your attention from where it stings to where the strokes are actually waiting.
What golfers blame vs. what's usually true
Once you've seen enough golfers' data, the misdiagnoses rhyme. Here are the most common ones — and where the strokes are usually hiding instead:
| What golfers blame… | What the data usually shows… | The real fix |
|---|---|---|
| "My putting" | Approach proximity — you're putting from 30+ feet too often | Practice approaches from 100–150 yards; track proximity |
| "I can't drive it" | Tee shots are fine; penalty and recovery decisions cost you | Smarter targets and disciplined layups off the tee |
| "My short game" | Short game is average; long irons are the real leak | Focused practice from 150+ yards |
| "I need a new swing" | Course management and start-line, not mechanics | Play scoring rounds, not swing rounds |
This is where EvoGolf is built differently from most golf apps. Most tools hand you a single round's stats and leave you to interpret them — a snapshot, not a story. EvoGolf captures your rounds, runs the strokes-gained math automatically, and ranks your categories by strokes to gain so your biggest opportunity is named, not guessed. It pairs that with ShotIQ™, a personal AI analyst you can simply ask: "Where am I losing the most strokes?" "Is it really my putting?" "What should I work on this week?" — and get a straight, data-grounded answer that updates as your game changes.
Turn your biggest opportunity into a plan
Naming the opportunity is most of the battle. Acting on it is a simple loop you can run on repeat:
- Track 8–10 rounds with consistent stats across all four categories.
- Rank the categories by strokes lost and pick the single biggest opportunity — the area with the most strokes to gain back.
- Aim ~70% of your next few practice sessions at that one category — at the exact distances or lies where you're bleeding strokes.
- Re-measure after 3–4 rounds. When that category stops being your worst, move to the next one.
The golfers who improve fastest think in terms of compounding. Half a stroke per round reclaimed from your worst category is worth more than a tenth shaved off three areas you're already decent at. Opportunity-first practice isn't the fun way — it's the fast way.
Frequently asked questions
You can't fix what you can't see. The golfers who break through aren't the ones grinding hardest — they're the ones who measured, found the one category quietly costing them the most, and aimed their practice straight at it. Do that, and "what's wrong with my game?" stops being a mystery and becomes a to-do list.
Because every stroke counts.
© 2026 EvoGolf. All rights reserved.